A Universal Concept Classification Framework (UCCF)

Background

Whether it’s for building the perfect chapter title, analyzing existing literature, or maybe just a personal etymological adventure,  there is usefulness in providing quantitative context to words and concepts. Should such a framework exist, it should be easy-to-understand and broadly applicable for authors, students, and other individuals alike.

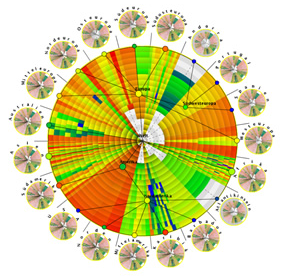
The Universal Concept Classification Framework (UCCF) proposed below involves five categories in which any word/concept can be scored. Each category’s score has range [0,20], spanning the full spectrum of possible values across each category. Where possible, the highest possible score for each category (20) should represent the more complex end of the spectrum (see below). The individual scores can then be summed to give a combined UCCF Score with range [0,100].

The individual category scores as well as the combined UCCF Score provide an easy way for readers and writers to understand and analyze the relative impact of certain words/concepts on readers, among other applications.

Universal Concept Classification Framework (UCCF)

  • Get (Concrete=0, Abstract=20): Low scores represent words/concepts that are concrete, tangible, well-defined, and easy to understand. High scores represent words/concepts that are abstract and open to interpretation.
  • Act (Controllable=0, Uncontrollable=20): Low scores represent words/concepts that are controllable, created, and/or driven by an individual, group, or machine. High scores represent words/concepts that are by nature uncontrollable.
  • Dim (Independent=0, Dependent=20): Low scores represent words/concepts that are independent of other words/concepts and can stand alone for meaning and interpretation. High scores represent words/concepts that are complex, very dependent upon other words/concepts, and are often very interconnected to support interpretation.
  • Set (Known=0, Changing/Unknown=20): Low scores represent words/concepts that are very well known and not subject to change in meaning or interpretation across time, language, and society. High scores represent words/concepts that change rapidly or may be universally undefined across time, language, and society.
  • Rad (Plain=0, Intriguing=20): Low scores represent words/concepts that are plain and without dimension. High scores represent words/concepts that are multidimensional, mysterious, and full of intrigue.

Limitations/Applications

No framework is without fault, and especially in the measurement of unstructured information, the UCCF certainly has limitations. However, it’s a quick and easy way to begin to better understand words/concepts, and I believe this type of methodology has broad applications.

One example is in the building of book titles and chapters, where authors may want to represent a broad spectrum of word types. One type of chapter may want to maximize combined UCCF Scores, others may want to keep combined UCCF Scores to a minimum, and a third type may want to have words that cover the widest range of combined UCCF Scores.

Another application may be in the analysis of certain authors, languages, or successful books in general. Do authors write about similar concepts according to the UCCF? Is there a correlation between successful books and the UCCF Scores represented by certain titles? These types of questions could be investigated using a new quantitative approach.

In general, applying simple quantitative methods to abstract ideas can provide a new way for thinking and contextualizing decisions, such as choosing book titles, and analyzing content and content creators, such as popular authors/bloggers.

A Simple Method for Analyzing Books

A recent Pew Research Center study found the following:

  • Americans 18 and older read on average 17 books each year. 19% say they don’t read any books at all. Only 5% say they read more than 50.
  • Fewer Americans are reading books now than in 1978.
  • 64% of respondents said they find the books they read from recommendations from family members, friends, or co-workers.
  • The average reader of e-books read 24 books (the mean number) in the past 12 months; the average non-e-book consumer read an average of 15.

The first bullet above is pretty remarkable. Using 17 books/year with, let’s say, 40 years of reading (above the age of 18), that’s 680 books read in adulthood. That’s a lot.

This got me thinking about how we decide which books to buy and how our decisions on which books to buy adapt with each book that we read. Are we in tune with our changing desires and interests and is our feedback loop from both positive and negative reading experiences, well, accurate and efficient?

Some time ago, I began collecting data on my book reading experiences to allow me to analyze exactly that. Given the Pew study, I figure I’ll share my methodology in hopes it makes sense to someone else. Star ratings such as that on Amazon are certainly helpful, but my hope is to perfectly understand what works for me as to make my decisions on reading material accurate, efficient, and part of a lifelong journey for knowledge and inspiration.

Known Data Elements (Both Categorical and Quantitative)

  • Author
  • Type (Non-Fiction vs Fiction)
  • Genre (Thrillers/Suspense, Science/Technology, Current Affairs & Politics, etc.)
  • Number of Pages (using hardcover as a standard)
  • Date Published

Personal Data Inputs (upon book completion)

  • Date Completed
  • Tags/Notes
  • Readability, Flow, & Structure (RFS) – A score ranging from [0.0, 5.0] subjectively assigned to a book based on ease-of-read and the overall structure of the book.
  • Thought-Provoking, Engagement, & Educational Value (TEV) – A score ranging from [0.0, 5.0] subjectively assigned to a book based on how mentally stimulating it was in terms of knowledge and thought.
  • Entertainment, Suspense, & Likeability (ESL) – A score ranging from [0.0, 5.0] subjectively assigned to a book based on the entertainment value and overall likeability of the story, characters, and/or information presented.

Those three metrics (RFS, TEV, ESL) allow one to create a overall score for the book. My overall score is a simple sum of the three metrics, divided by the maximum possible score (15.0), and expressed as a percentage (ranging from 0% to 100%). Although I have not yet conducted any correlation studies or categorical analyses using my data (which I have for 42 books starting in Aug 2004), below is a snapshot. As for my next book, it’ll probably be a self-help guide to drop the data obsession. 🙂

Title Author Pages RFS [0,5] TEV [0,5] ESL [0,5] SCORE [0,100%]
A Short History of Nearly Everything Bill Bryson 560 4.5 5.0 4.5 93%
The Alchemist Paulo Coelho 208 4.5 4.5 4.5 90%
Life of Pi Yann Martel 336 4.5 4.0 4.5 87%
Moneyball: The Art of Winning an Unfair Game Michael Lewis 288 4.0 4.5 4.0 83%
Born to Be Good: The Science of a Meaningful Life Dacher Keltner 352 4.0 4.5 3.5 80%
The Tipping Point: How Little Things Can Make a Big Difference Malcolm Gladwell 288 4.0 4.0 4.0 80%
The Next 100 Years: A Forecast for the 21st Century George Friedman 272 4.0 4.5 3.5 80%
Super Freakonomics: Global Cooling, Patriotic Prostitutes, and Why Suicide Bombers Should Buy Life Insurance Steven Levitt; Stephen Dubner 288 4.0 4.0 4.0 80%
Super Crunchers: Why Thinking-By-Numbers is the New Way To Be Smart Ian Ayres 272 4.0 4.0 4.0 80%
The Art of Strategy: A Game Theorist’s Guide to Success in Business & Life Avinash Dixit; Barry Nalebuff 512 4.0 4.5 3.5 80%
The Long Tail: Why the Future of Business is Selling Less of More Chris Anderson 256 4.0 4.0 3.5 77%
Outliers: The Story of Success Malcolm Gladwell 309 4.0 4.0 3.5 77%
Body of Lies David Ignatius 352 4.5 3.0 4.0 77%
A Walk in the Woods: Rediscovering America on the Appalachian Trail Bill Bryson 284 3.5 4.0 3.5 73%
Kill Alex Cross James Patterson 464 4.5 2.5 4.0 73%
The Increment David Ignatius 400 4.0 2.5 4.5 73%
A Whole New Mind: Why Right-Brainers Will Rule the Future Daniel Pink 272 4.0 4.0 3.0 73%
Blink: The Power of Thinking Without Thinking Malcolm Gladwell 288 3.5 4.0 3.0 70%
Physics of the Impossible: A Scientific Exploration into the World of Phasers, Force Fields, Teleportation, and Time Travel Michio Kaku 352 3.5 4.0 3.0 70%
The Bourne Dominion Eric van Lustbader 432 3.5 2.5 4.5 70%
Fortune’s Formula: The Untold Story of the Scientific Betting System That Beat the Casinos and Wall Street William Poundstone 400 3.0 4.0 3.5 70%
The Godfather Mario Puzo 448 3.5 2.5 4.5 70%
The Sicilian Mario Puzo 410 3.5 2.5 4.5 70%
The Invention of Air: A Story of Science, Faith, Revolution, and the Birth of America Steven Johnson 272 3.0 4.0 3.0 67%
The Drunkard’s Walk: How Randomness Rules Our Lives Leonard Mlodinow 272 3.0 3.5 3.5 67%
Cross Fire James Patterson 432 4.0 1.5 4.5 67%
The Social Animal: The Hidden Sources of Love, Character, and Achievement David Brooks 448 3.5 4.5 2.0 67%
The Golden Ratio: The Story of PHI, the World’s Most Astonishing Number Mario Livio 294 3.0 4.0 2.5 63%
Physics for Future Presidents: The Science Behind the Headlines Richard Muller 354 3.0 3.5 3.0 63%
The Future of Everything: The Science of Prediction David Orrell 464 3.0 3.5 3.0 63%
The Department of Mad Scientists Michael Belfiore 320 3.0 3.0 3.5 63%
For the President’s Eyes Only: Secret Intelligence and the American Presidency from Washington to Bush Christopher Andrew 672 3.0 3.5 3.0 63%
Born Standing Up: A Comic’s Life Steve Martin 209 4.0 2.0 3.0 60%
Science is Culture: Conversations at the New Intersection of Science + Society Adam Bly (Seed Magazine) 368 2.5 3.5 3.0 60%
1491: New Revelations of the Americas Before Columbus Charles Mann 480 2.5 3.5 2.5 57%
The Curious Incident of the Dog in the Night-Time Mark Haddon 226 3.0 3.0 2.0 53%
Group Theory in the Bedroom, and Other Mathematical Diversions Brian Hayes 288 2.0 3.5 2.0 50%
Euclid in the Rainforest: Discovering Universal Truth in Logic and Math Joseph Mazur 352 2.0 3.0 2.5 50%
This is Your Brain on Music: The Science of a Human Obsession Daniel Levitin 320 2.5 3.0 1.5 47%

The Future of Analytics and Operations Research (WINFORMS Panel Discussion)

Program/Title: The Future of Analytics and Operations Research
Organization: Washington, DC Chapter of the Institute for Operations Research and the Management Sciences (WINFORMS)
Date/Time: Tue February 21, 2012 1800-2030 EST
Description: The exponential explosion in the amount of data available has spawned a new field: “analytics.” This recent arriviste is forcing the operations research (OR) community to reconsider how we work, with both clear benefits and risks – not only in areas like data integrity, but the very foundations of statistical problem-solving. How do we define analytics, and how does analytics relate to OR? What is the future of analytics? We’ll ask these provocative questions and others to three of our best OR intellectuals in the Washington DC area.

General Notes / Topics of Discussion

  • The difference between having an “outcomes focus” versus a “process focus”
  • Scope of similar disciplines – analytics and operations research – are they competing or allied?
  • Communication to decision makers critical – how are these skills being developed in both disciplines?
  • Philosophy of science / having the “soft skills” – is this taught, learned, or experienced?
  • When to shy away from problems – lack of customer support, intended answer, etc.
  • The difference between problems and messes… which is worse?
  • Defining constraints/limitations and discussing assumptions (e.g. acceptable solutions under certain budget constraints)
  • The importance of defining (and redefining) the problem. Critical in today’s business climate.
  • Ideal skills: Hacker skills, subject matter expertise, communication skills, ability to listen, wargaming, organizational psychology, humility, natural curiosity
  • Other related disciplines: Data Science, Statistics, Business Analytics, Big Data, etc. – how do these affect the operations research community?

Further Reading / Related Links

Stop Talking & Start Digging: The Importance of Getting Dirty with Data

Today’s world can be characterized by increasing speed, complexity, disorder, and interconnectedness. For organizations trying to understand their operating environment, develop products, improve services, advance their mission, identify gaps, and support overall decision-making and strategic planning, this presents a wide array of challenges. As a result, organizational processes should be focused on overcoming these challenges and should be driven by the desire for solutions – forward-looking solutions that better understanding, improve productivity, increase efficiencies, and maximize the chance for success.

Finding or creating a solution to a complex problem requires careful planning and thought. We must beak down the problem into simpler, manageable components, identify and characterize root causes, and involve relevant stakeholders in discussions and feedback sessions. We must look across our sources of data, identify any real limitations and gaps, and plan how to execute some analytical methods across the data to extract insights. The problem is, in a world of accelerating information, needs, and problems, it’s just too easy to get caught in the planning and thinking stage. We need to get down and dirty with our data.

In the year 2011, we are surrounded by resources, libraries, catalogs, tools, and software – much of it open source and/or freely available for our own personal (AND collective) use. We must learn to access and leverage these resources efficiently, not only to perform cleansing and synthesis functions, but also to inform our collection and analysis processes to make them better as time goes on. Armed with these resources and tools, we must feel comfortable jumping right into our data with the confidence that insights will be gained that otherwise would have been lost in time.

Slicing is a helpful example of this. When faced with a high-dimension data set, usually with poorly described variables, start by slicing the data into a manageable chunk with high-powered variables – time, location, name, category, score, etc. Use a data visualization program to understand order, geospatial distribution, or categorical breakdowns. Describe the data and ask questions about how collection processes led to any gaps that exist. Simple slicing and dicing separate from the root analysis can often chart a potentially workable path forward.

The bottom line is that whether it’s dirty data or larger-scale, socially-complex problems, we sometimes need to shorten the discussion of the problem itself and get our hands dirty. Sometimes we need to create a little chaos upfront in order to shake things loose and find our intended order, structure, and path forward. After all, planning your dive is important, but sometimes you need to just dive in and see where it leads you.

Ten Technological Concepts Compressing the Analytical Timeline

Today’s difficult economic climate continues to cause increased competition for all organizations. Shrinking budgets are placing government departments and agencies under more pressure to increase operating efficiencies and cost-effectiveness of programs and technologies. Across industry, fragile markets have caused organizations to consider the need for every project, person, and printer to reduce operating costs. In the non-profit sector, slimming funding streams have caused an increased pressure to demonstrate value through concrete, measurable results.

In order to stay competitive within their particular domains, markets, and user communities – and to ultimately achieve growth and sustainability in any economic climate – all organizations must find ways to increase operating efficiencies, eliminate programmatic redundancies, and produce measurable results. Lucky for these organizations, several technological concepts have emerged over the past decade which help support these practices. In that regard, the acknowledgement, understanding, and implementation of these concepts across organizational units, programs, and processes will compress the analytical timeline and allow organizations to learn, control, adapt, and anticipate over time.

Here’s a quick look at some of the technological concepts/trends that are compressing the analytical timeline, allowing organizations to act on insights more quickly, more effectively, and more accurately:

  1. Data Collection Mechanisms – It’s not just about collecting more data, although volume (in many cases) helps. It is about collecting more types of data (image, audio, video, open source media, social media) and collecting more tactical data. The growth of the mobile and tablet markets, the ease-of-use of such devices and their decreasing costs, and the expansion of mobile network infrastructure around the world are helping organizations collect more diverse, tactical, and (ultimately) valuable data.
  2. Data Cleansing/Processing – Rather than ignoring unstructured data, we are beginning to embrace it. Many COTS, GOTS, and even open source technologies exist that cleanse and process unstructured data to ensure it can be used to support relevant use cases. Where unstructured data was formerly omitted from the analytical landscape, these technologies are now bringing new value and context to insights and decisions. Within this I want to also add the data storage/warehousing and processing capabilities that support big data analytics and data mining, which provides a quicker means by which the vast amount of data can be combed for relevant patterns and insights.
  3. Logical Data Structures – It seems we are finally learning that a little thought and planning up front does wonders for the types of analysis needed to support operations research, performance measurement, marketing, and other organizational practices. By building logical data structures, we can quantify things otherwise unquantifiable and ultimately make timely, informed decisions otherwise made by intuition alone.
  4. Data Standards/Models – In conjunction with building supportive, internal data structures, we are beginning to understand how data models within domains, across communities of interest, and for specific problem sets can do wonders for our analytical practices. By developing and/or adopting a standard, we can bring consistency to these analytical practices over time, even through personnel changes. No more one-off studies/reports, but rather repeatable and communicable analysis.
  5. Data Source Registries/Catalogs – It is slowly being understood that ubiquitous access to raw data sets is far from a reality. However, organizations are beginning to realize that data source catalogs (registries) across organizational units and/or communities of interest is a step that can quickly facilitate more effective data sharing practices. Rather than focus on the exposure of raw data, the data source catalog first involves the exposure of data source metadata – information about the data, but not the data itself. This data sharing approach is more strongly rooted in trust and visibility and, ultimately, can provide a platform by which analysts can gain quicker access to more relevant data.
  6. Social Networks – The social network movement has done many things to compress the analytical timeline, to include, but not limited to: driving more collaboration and interaction between data owners, analysts, end users, and ordinary people; driving a new means by which more tactical data can be accessed and collected; and facilitating the development of new platforms, applications, and technologies to glean insights from data.
  7. Identity Management, Access Control, & Cyber Security – Knocking down stovepipes can support better access to data which in turn can support less time collecting data and more time analyzing it. However, stovepipes provide organizations with another layer of security to prevent data breaches. Despite this contradiction, better identity management, access control, and security technologies are being developed to maintain a high level of control while still ensuring users can more easily access data traditionally hidden within stovepipes. In turn, the time spent accessing and integrating data is decreased and individuals can spend more time analyzing disparate data and delivering quality insights.
  8. Cloud Computing – The movement of information systems and applications to the cloud is transforming the analyst from being a thick-client-loving info hog to being a platform-agnostic, collaborative participant. With more data and tools exposed to individuals, no longer constrained by a single hard drive or device, analysts can more effectively and efficiently access, collect, integrate, visualize, analyze, share, and report on data and insights.
  9. Network Infrastructure – The expansion of existing connected and wireless networks as well as the development of new, quicker, more accessible, and more secure networks will continue to compress the time it takes for analysts to provide valuable insights.
  10. Customizable & User-Defined Interactions – Allowing individuals to define how they wish to visualize, analyze, and interact with relevant data provides analysts with the ability to focus on developing solutions rather than setting up problems. The “user-defined” movement provides flexibility and adaptability to the individual and allows a wider set of individuals to become analysts by owning their own workspaces and interactions. It also provides an interactive medium through which results can be presented, making the reporting and dissemination process interactive rather than a drawn out one-way street.

I do want to note that this list is by no means comprehensive. Even more importantly, it only focuses on technological concepts and does not address the numerous cultural and political factors that affect the analytical timeline. Although technology shall continue to be a major focus area in supporting quicker and more effective analytical practices, it is the cultural and political aspects that will be more difficult to overcome and their interdependence on the technological aspects should never be overlooked.

The Power of Anticipation

In today’s society, gaining an inch can be like gaining a mile.

Soccer takes a lot of skill and athleticism. You need to be able to dribble, pass, shoot, tackle, communicate, see, sprint, etc. But as I’ve stated before (“mind bend it like beckham” – 2/11/2009) it’s just as much a mental game as it is a physical one. You need to think like your opponent and play somewhat of a guessing game, connecting dots before there’s any visible relationship between them. You need to forecast outcomes, intellectually seeing into the future guided by the data that’s available.

This sort of anticipation is an imperative ability for success in the future – within any endeavor. In business, anticipation means a gaining a leading edge on the competition. For defense, it means preparation and contingency plans for what might be likely to occur. In decision-making its gaining threshold confidence in your decision – using as much relevant information to guide a range of actions, opinion,s and ultimately, outcomes. And not to mention, it helps us grab our umbrella when running out the door.

Predictive analytics, although a seemingly new, hot topic today, has been around forever. Prophets, Mayans, Nostradamus, Pythia, lunar calendars, and the Akashwani – in a historical sense the predictions were informed by a variety of sensory stimuli coupled with intuition and a variety of other external factors. Nowadays, it’s really not that different. Today, we have data and semi-sophisticated mathematical processes that parallel conscious perception and intuition. We can quantify much of what could not have been quantified in the past.

“Predictive analytics encompasses a variety of techniques from statistics, data mining and game theory that analyze current and historical facts to make predictions about future events.

In business, predictive models exploit patterns found in historical and transactional data to identify risks and opportunities. Models capture relationships among many factors to allow assessment of risk or potential associated with a particular set of conditions, guiding decision making for candidate transactions.” (Wikipedia)

It’s imperative that people embrace predictive analytics to inform decision-making. Math doesn’t have to make the decision – that’s mostly for humans – but the math can give a comprehensive picture that outlines components of the decision and also tells us what the decision may lead to (or may have led to in the past) in terms of primary, secondary, and tertiary outcomes. Bruce Bueno de Mesquita is a great example of this, using computer algorithms to predict world events of the future – war, proliferation, conflict, etc. Decisions are not made by computer models, but humans are briefed of probable scenarios in order to make better-informed decisions.

I’ve said this before – math can be simple when it’s made to be simple. It’s a toolbox of problem-solving techniques and thought processes to help guide real-world decisions and understanding. It’s important to not be afraid of the math – start small and grow your mathematical toolbox over time. Take it head on and don’t be overwhelmed. We all have something to learn and we all have something to gain by embracing prediction and anticipation.

So whether it’s sport, meteorology, national security, or adding garlic to the pan, find a way to anticipate. In doing so, my prediction is that you’ll be better off…

Links

The New Garage of Analytics

Analytical consulting requires more than a computer, some data, and some coding. It requires effective organization, proper communication, innovative methods, and what I call “meaning motivation” – the innate desire for insight, the curiosity for understanding, an appetite for intellectual exercise.

That having been said, I’d like to organize a new garage of analytics. These are some of the toolboxes necessary for solving complex problems in a ever complex world. These are the toolboxes we access for effective organization, proper communication, method innovation, and meaning motivation.

And in terms of process, math aligns us to break complex problems into those that are much simpler to understand and digest while still seeing the big picture and the end goal. This very much follows that concept. No problem will be exactly like another, but if we follow a similar digestion process to attack complex problems, well, at least our stomach will not be upset.

The Organizational Toolbox

The Sociological Toolbox

The Analytical Toolbox

The Visualization Toolbox

The Balance Toolbox – A step away is sometimes the best step forward.

  • Artistic Expression
  • Fitness/Exercise
  • Learning
  • Reading
  • Sleeping
  • Talking
  • Traveling
  • Writing

The Ultimate Personal Dashboard

With some great technological advancements in the past decade, why am I still organizing my life in bookmarks and spreadsheets?

The next great technology needs to get more personal. We need to drop the rectangular web browser and think in higher dimensions. Let’s say iGoogle meets Macbook Dashboard meets a much better version of the new Yahoo! homepage meets the iPhone application platform. I’m talking about a secure, personal, customizable dashboard/portal through which one can live. It’s where I’ll track my information, both from the web and my mind to better organize and optimize my life. It’s where I’ll see and interact with my personal data in a comprehensively insightful yet very organized environment.

Right now, how do I track my information? Some is on the web, some is on my hard drive, and some is on paper. I have over 200 username and password combinations I use to login to various sites. I’ve got at least 250 bookmarks in 15 top-level categories. I’ve got spreadsheets that summarize my finances and visuals I’ve created to try and learn about them. For now, when I need to know something, I find the appropriate link, look up my account credentials (if not stored), and then investigate. But for those in a similar place in life, are my personal needs really that different?

If I list out all the things I do online, all the things I read online, all the information I organize on my computer, all the personal resources I access online, and all the questions I might have about myself, can I begin to minimize some clutter? Can I get Google Reader, Macbook Dashboard, iGoogle widgets, social network widgets, and personal spreadsheets in a secure, organized interface? Please?

Base

  • Accounts – Search logins by account, email, username, password, notes, date added, date updated
  • Address Book – Contact Info, birthdays, anniversaries
  • Links – Yahoo!, Google, GMail, CNN, Wolfram|Alpha
  • System Stats – Files/Folders, latest backup, storage space
  • Weather – Today’s weather, 7-day forecast, full interactive radar/satellite map

Financial

  • Bills – Due dates, billing cycles, average costs due
  • Energy Monitor – Monitor your home utilities, set “green” goals
  • Finances Monitor – Monitor stocks, IRAs, retirement, savings, checking, credit card
  • PayPal – Request/receive payments, see pending invoices
  • Subscription Management – Expected issues, renewal dates,

News/Events

  • Coming Soon – Movie releases, Tickets on sale, Upcoming concerts (Thrillist, Ticketmaster, Fandango)
  • Google Reader Tracker – Total unread, shared items, etc.
  • Local – Weekend Events (Going Out Guide, Eventful, etc.), Breaking News
  • News – CNN News Pulse
  • Sports – Scores/News

Social Media/Networking

  • Brand Monitor – See sentiment for desired keywords/terms
  • Discussion Board Monitor – Track your posts and comments, desired forums
  • Hot Topics – See trend topics and most searched items
  • Notifications – Facebook, LinkedIn, Twitter
  • Social Timeline – LinkedIn Updates, Twitter Lists, Status Updates
  • Web Analytics – Twitter Stats, Google Analytics

Entertainment

  • Movies – Times, upcoming releases, IMDB search, RottonTomatoes rankings
  • Music – Playlists, connect with Grooveshark albums, iTunes Radio, etc.
  • Photos – Flickr/Picasa portlet
  • Sports – Fantasy team tracker, favorites scoreboard, breaking news
  • TV – Guide, schedule of favorites, DVR control

Health

Lists

  • Map – Where I’ve Been, Where I want to go
  • Reading List – What I’ve Read, What I’m Reading, Connect to Amazon
  • Recipes – Saved links, suggested items, BigOven link
  • Shopping – Grocery (connect with PeaPod), Retail deals/coupons
  • Tasks / To-Do
  • Watch Lists – eBay Auction, StubHub
  • Wish List – Amazon, iTunes, Retail Stores

Utilities

  • Calculator
  • Currency Conversion
  • Dictionary/Thesaurus (Wordnik)
  • Flight Tracker
  • Job Tracker – Monster, USAJobs, search agents
  • Maps – My placemarks, directions, search locations
  • Shipment Tracker – UPS, USPS, FedEx, etc.
  • Translator

This is just a list of things I do, need, have, and want. Obviously there are a lot more to be added. It’s important to note that all of these widgets/portlets have a similar foundation that parallel the major dimensions (in light blue) I spoke about in my earlier post on the boundaries of the human condition:

Accounts – List of all companies/organizations. Information is tagged by the company and all info can be found with regards to that account, when needed.
Dates/Time – Many things are calendar-based and should be aggregated to a personal, customizable calendar view
People – Address Book is a foundational database. People can be searched throughout for linkages and notes.
Places – With the current technological trend, many needs are location-based (including news and tweets). Personal organization dashboards should leverage geo-tagging for contextualization of information to the user.

It’s also important to note that most people want information in 3 forms: a quick preview, an expanded summary, and an interactive tool. This follows closely with a recent social trend – high variability in the speed with which we move. Sometimes we want a snapshot of our current personal information because that’s all that we have – a few seconds of time. At other times, we may have a few minutes of free time, most likely coupled with a defined question or purpose:

“How much do I have in my checking account?”
“What will the weather be like this weekend?”
“Need to transfer rent money to roommate.”
“Did my package arrive safely?”
“Who has a birthday in the next month?”
“What are the hot news items of the day?”
“I want to buy a book from my Amazon wish list.”
“To which country should I travel next summer?”

And finally, this cannot be overwhelming. It needs to be there when you need it but not short circuit your mood if you don’t check it for three weeks. All charts and graphics need to be simple and interactive and customizable, but also intelligent in design to attract the most novice of digital users.

So what will the next decade bring us? Will personal desktop technology be able to fully leverage the vast amounts of data we have online, on our computers, and in our heads? Will the world become more stat-conscious, and learn to take insight from the graphical display of life data? Will the desire for a less-click lifestyle drive better personal dashboards for secure, centralized organization? I hope so.

data visualization

The visualization of data exists at the intersection of art, science, and technology. The absence of one of these inputs leaves the viewer unsatisfied in terms of both comprehension and stimulation.

It takes both hemispheres of the brain to produce a truly outstanding graphic – a mesh of logical and analytical components with intuition and creativity. Creators must know the basics of audience, tone, color, consistency, and purpose while understanding technical and scientific limitations of particular data analyses and visualization methods/tools. Creators must also be their own best critic, and be able to ask the right questions at the right time. When done correctly, a final result should bring engaged thinking and meaning to a viewer, no matter how simple the underlying objective.

That being said, I wanted to post some interesting data viz resources to hopefully inspire new creativity and awareness around data visualization. Those are listed below. As a note, some were listed in the latest issue of AmstatNews (monthly publication for the American Statistical Association). All descriptions are from the respective websites and/or other related web resources.

Websites
Flowing Data – FlowingData explores how designers, statisticians, and computer scientists are using data to understand ourselves better – mainly through data visualization. Money spent, reps at the gym, time you waste, and personal information you enter online are all forms of data. How can we understand these data flows? Data visualization lets non-experts make sense of it all.
Gallery of Data Visualization – This Gallery of Data Visualization displays some examples of the best and worst of statistical graphics, with the view that the contrast may be useful, inform current practice, and provide some pointers to both historical and current work.
Gapminder – Gapminder is a non-profit venture promoting sustainable global development and achievement of the United Nations Millennium Development Goals by increased use and understanding of statistics and other information about social, economic and environmental development at local, national and global levels.
Graph Jam – Music & culture for people who love charts. Some recent posts include “Ways I spent my time while playing Oregon Trail in elementary school” and “Things that the Pinball Wizard does”.
IBM Many Eyes – As part of IBM’s Collaborative User Experience research group, the Many Eyes lab explores information visualizations that help people collectively make sense of data.
Information Aesthetics – Inspired by Lev Manovich’s definition of “information aesthetics”, this weblog explores the symbiotic relationship between creative design and the field of information visualization. More specifically, it collects projects that represent data or information in original or intriguing ways.
Junk Charts – Recycling chartjunk as junk art.
Marumushi Newsmap – Newsmap is an application that visually reflects the constantly changing landscape of the Google News news aggregator. A treemap visualization algorithm helps display the enormous amount of information gathered by the aggregator. Treemaps are traditionally space-constrained visualizations of information. Newsmap’s objective takes that goal a step further and provides a tool to divide information into quickly recognizable bands which, when presented together, reveal underlying patterns in news reporting across cultures and within news segments in constant change around the globe.
NameVoyager/NameMapper – This is the online home of Laura Wattenberg, author of the bestselling book The Baby Name Wizard and creator of award-winning tools that have helped the world look at baby names in a whole new way. Check NameVoyager and NameMapper which show temporal and geographic representations of any name in a simple, intuitive interface.
Optical Illusions and Visual Phenomena – Easy to spend lots of time here. These pages demonstrate visual phenomena, and ‘optical’ or ‘visual’ illusions. The latter is more appropriate, because most effects have their basis in the visual pathway, not in the optics of the eye.
Prefuse – Prefuse is an extensible software framework for helping software developers create interactive information visualization applications using the Java programming language. It can be used to build standalone applications, visual components embedded in larger applications, and web applets. Prefuse intends to greatly simplify the processes of representing and efficiently handing data, mapping data to visual representations (e.g., through spatial position, size, shape, color, etc), and interacting with the data. Flare is particularly cool.
Tableau Software Blog – Official blog for Tableau Software, a data visualization software company headquartered in Seattle. I’ve used Tableau Desktop for a few years now and can’t live without it now.
The Work of Edward Tufte and Graphics Press – Official Edward Tufte site. He is an American statistician and Professor Emeritus of statistics, information design, interface design, and political economy at Yale University. He has been described by some as “the da Vinci of Data”.
UC Berkeley Visualization Papers – A listing of papers from the visualization lab at UC Berkeley, from today back to 1995.
Visualization of Complex Networks – This site intends to be a unified resource space for anyone interested in the visualization of complex networks. The project’s main goal is to leverage a critical understanding of different visualization methods, across a series of disciplines, as diverse as Biology, Social Networks or the World Wide Web.

Well-Formed Data, Elastic Lists Demo – This is a demonstration of the “elastic list” principle for browsing multi-faceted data structures. There are additional options to create sparkline charts to show the temporal aspects of the data.
Papers / Presentations
7 Things You Should Know About Data Visualization – EduCause Learning Initiative
Artistic Data Visualization: Beyond Visual Analytics – Viégas & Wattenberg, IBM Research
Designing Great Visualizations – Jock Mackinlay, Tableau Software
Milestones in the History of Data Visualization – Friendly & Denis, York University