Current DC Snow Snapshot & Stats

Well there’s lots of snow in DC! Reports say this will surpass total snowfall of any storm in the past decade, and we may have to look even farther back than that. Right now (9:30 AM ET) there is about 10 inches or so, and it’s still coming down fast and fluffy. Woohoo!

To put this in perspective, let’s look at some average monthly snowfalls for the Washington, DC area vs the rest of the United States. Data is from the National Oceanic and Atmospheric Administration (NOAA) National Climatic Data Center (NCDC) and represents the past 40 years of data for DC and (on average) 52 years for the rest of the United States. Total stations is 276, many from the weather stations at regional/national airports. Here is the raw data set (before I cleaned it up for visualization).

To note, the total average annual snowfall for Washington, DC is about 19.5 inches, while the total average annual snowfall for the rest of the United States is about 32.2 inches. This does, however, include some extreme values from Alaska (and Puerto Rico for some zeros too). The maximum annual snowfall was at Valdez, Alaska with 326.0 inches. If I was to do this comparison again, I might trim some extremes from both sides of the data set, but now it’s time to go play in the snow.

Everything Is Connected

Whether it’s love and hate, birds and weather, past and future, or me and you, there are connections – both hidden and in plain sight – in everything. More than ever, we are finding that the world is a web, and I’m not just talking about the internet. That being said, the internet does help us bring some new connections to the surface through data sharing, communication, and information retrieval.

Math is a valuable support mechanism for these types of connections, especially when credible data exists that is representative of both sides of the river. It often can build the bridge to connect the shores, although it cannot always build traffic between the two.

I’ve posted before on the connections of seemingly unrelated phenomena. How can we determine where connections should (and should not) exist? How can we determine the strength and impact (both direct and potential) of such connections? What are the implications of humans controlling such connections and manipulating the bare characteristics by which some things are connected? These are questions to which we may never have an answer, but it’s important to at least ask the questions and attempt the answers. You never know where a new bridge might appear.

Whether its physical, metaphysical, mathematical, sociological, technological, chemical, theological, biological, philosophical, etc. the connections do exist. To start, we know scientific law covers the physical: Newton’s Law of Universal Gravitation tell us that every object in this universe attracts every other object with a force that is directly proportional to the product of their masses and inversely proportional to the square of the distance between their centers. For the others, well, let’s just say the bridges are infinite and are always under construction.

math in 2010 and beyond

If we want to fuel future growth and innovation in mathematics, three worlds must meet in the middle.

In 2009, we see three distinctly developed worlds:
  • The Communities: Math + People = Associations, Publications, Journals, Groups, Departments (ASA, IMS, WFU Math, etc.)
  • The Connectors: People + Technology = Social Media & Social Networks (Facebook, LinkedIn, Twitter, iPhone Apps, etc.)
  • The Foundations: Math + Technology = Software/Web Applications (Wolfram|Alpha, SAS, R, Matlab, Mathematica, Statistica, etc.)

In 2010, we need these three worlds to mold into one, unified experience. With whom does the responsibility lie and when does it start? You and now.

life optimization through estimation

The ability to accurately estimate a target value is an asset to any brain. Learn to hone this ability, embrace it, and use it to optimize your life.

Our lives are surrounded by invisible data – most of it in units of time, energy, space, and money. Essentially, our brains are huge folded databases that store this data, and use it to make decisions, plan ahead, and live each day. But as with many types of data, there exists some uncertainty about that data. Unknowns about how long, how big, how much, from where, until when, should i, almost enough, maybe tomorrow… well you get the picture. Our life data is filled with unknowns.

That’s why estimation is essential. Without it we’d get lost, fall behind, and lose our sense of security and awareness. Whether we know it or not, our brains constantly work to estimate and approximate values, given set of life data at that moment in time. And whether we know it or not, our brains run predictive models to assess hypothetical scenarios, basically using present life data to predict future life outcomes.

These are important realizations, and strong connections of human nature to an innate mathematical realm. Estimation is both an art and a science, as it takes creativity and thought supported by various numerical methods. Having the mathematical ability to estimate proves useful in most situations, but without the artistic component, you lose the ability to understand and contextualize your estimation.

The main point here is that estimation should be embraced as part of human nature, supported by numerical methods. This is how we can optimize our life – by recognizing the units with which our lives are measured each day, and reducing as much uncertainty in those values as humanly possible. It will not make you completely successful and happy and secure, but it will get you close.

Examples

Here are some random examples of estimation from my life. The methods of estimation vary, but the fundamental questions being asked all have outcomes of an unknown nature.

1. Shopping: Budgeting $150 for a dinner party, break budget down to categories of purchases then allocate funds accordingly. Estimate totals and percent of total budget category to make decisions on necessity.
Outcome: Go bigger on the dinner and ask a couple guests to bring desserts.

2. Sports: Ten minutes left in the game, down by 2 goals. Have two full lines of players so will sub soon and again with 4 min left. Need at least 1 goal every 4 minutes leaving a 2 min buffer to protect the tie and go for a win, should allocate 60% of strategy to offense and 40% to defense for next 8 minutes. If I’m in for 6 min and need 60% offensive mindset, how inclined should I be to make a run towards the goal, leaving my defensive position?
Outcome: Win

3. Personal Finance: How much to take out at the ATM? Need to estimate expenses for the week – lunch, happy hour, gas, dinner, cab to meeting, etc. How often will I use my credit card? Am I more inclined to spend if I have cash? Will I be near another ATM this week if I need more cash? How conservative should I be in my spending given the holiday season is arriving?
Outcome: Take out $60 and bring lunch.

4. Daily Planning: Got a hour-long meeting at 3:30pm, soccer game at 6:30pm. Assuming there will be traffic, it will take me 35 minutes to get home then 5 minutes to change, 10 to heat up leftovers, 10 to eat, and 15 to switch and fold laundry. Need 25 minutes to get to field and 15 min to warm up. Will I have enough time if my 3:30pm meeting goes long or do I need to put off the laundry and/or dinner?
Outcome: Always put off laundry, but never dinner 😉

Links

Estimating how much gold there is in the entire world
Estimating how much money there is in the entire world
Estimating the height of anything using geometry
A bit about estimation in statistics

update #2: this year in baseball

Note: This post is related to my February 22, 2009 post on baseball predictions and the mid-season update of those predictions from July 24, 2009.

Well the regular season is over (minus a 1-game AL Central playoff game) and this means the results are in. Here’s how my predictions for the AL East standings turned out:


Predicted AL East Standings 
(February 22, 2009)
Yankees 101-61 (62.4%)
Red Sox 95-67 (58.6%)
Rays 84-78 (51.9%)
Blue Jays 80-82 (49.4%)
Orioles 72-90 (44.4%)

Current AL East Standings 
(October 5, 2009)
Yankees 103-59 (63.6%)
Red Sox 95-67 (58.6%)
Rays 84-78 (51.9%)
Blue Jays 75-87 (46.3%)
Orioles 64-98 (39.5%)

The order is correct, the Red Sox and Rays are exactly right, the Yanks are off by 2 games, the Blue Jays are off by 5 games, and the Orioles are off by 8 games. Collectively, the predictions are off by an average of 1.8% which is very good. If only I knew that the Blue jays would tumble and the Orioles were going to fight the Nats and the Pirates for the worst team in the league.

So the playoffs are coming up, and the match-ups are set (except for the AL Central division winner). The Yankees shouldn’t have a preference between the Twins or Tigers because they will most likely whoop either of them. The Yanks were 7-0 vs the Twins this year (although five of the games were decided by 2 runs or less) and were 5-1 vs the Tigers this year (with a combined score of 30-15). It would be nice to avoid Verlander for two games in a match-up vs the Tigers, but it’s safe to say the run production and grit of the Yanks will definitely put them into the ALCS, regardless of their opponent.

I think it’ll be against the Angels. Sure, everyone roots for a NY-Boston match-up, and Boston typically does well against the Angels, but I think we’ll see a long series end with the Angels moving on.

And despite struggles versus the Angels, the Yanks silence the haters and beat them, winning the ALCS in 6.

In the NL, we’ll see the Cards beat the struggling Dodgers (sorry Torre & Donnie!), and the surging Rockies knock off the Phillies. Cardinals beat the Rockies in a great 7-game series to win the NLCS.

Yankees vs Cardinals World Series: I’ll keep this one simple. Yankees prove they are once again they are the most dominant team in the history of the universe. Carpenter gets a win in a thriller but the Yankees dominate the rest, winning the series 4-1. If you think anything different will happen, then you are crazy. The Yankees are unbeatable now, and will be for the rest of time.

ranking cereals

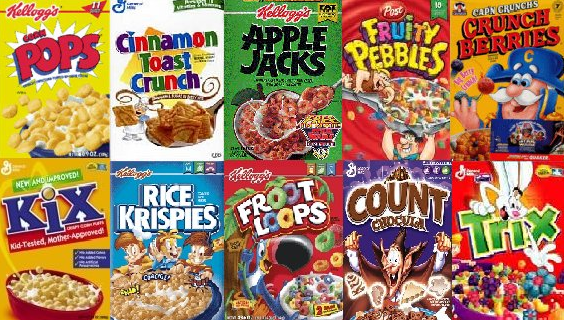
I just bought my first box of cereal in a while. At the grocery store, an entire side of an aisle was completely filled with cold cereal – every brand and flavor and shape and color you could imagine. Very nice variety for a common breakfast food and afternoon snack – a lot more than I remember.

I really wish I could see some data on which cereals do best for which age groups, during which months of the year, and purchased at what time of day. It’d be interesting to compare marketing campaigns too. Does anyone buy the big box of Kelloggs Smacks cereal? I didn’t think so.


Anyways, all this got me thinking… what are the qualities of a good cereal? Would the output of a cereal ranking algorithm be similar to my instinctive ranking of cereals? Let’s find out.

Here are the parameters by which I scored a list of 26 different cereals, including 3 hot cereals:
Healthiness – Sugary cereals, chocolate cereals, etc. If they leave the milk tasting like melted ice cream, chances are it’s not too healthy. (1=Healthy, 2=Intermediate healthiness, 3=Not healthy)
Texture – Everyone loves a crunch. I’m not talking the texture that hurts your gums when you eat it dry, but the texture where pieces clump nicely in the spoon and are accepting to a big chomp. (1=Great texture, 2=Okay texture, 3=Boring texture)
Fun Factor – The box, the games, the toys, the colors, the shapes, the mascots, the commercials, etc. (1=Very fun cereal, 2=Intermediate fun, 3=Not very fun)
Good w/ Fruit – For me, this is key. I enjoy adding banana, strawberries, and/or blueberries to my cereal. (1=Good with fruit, 2=Not good with fruit)
Needs Sugar – Despite it’s probable inherent healthiness, if it’s bland, it stinks. If you have to add sugar to make it hit the spot, we have to drop its ranking. (1=Does not need sugar, 2=Needs sugar)

Scores were summed up across all parameters. The cereals were then sorted from lowest score to highest score to retrieve the final ranking of cereals. As a note, the ‘Good w/ Fruit’ and ‘Needs Sugar’ fields were weighted slightly lower than the other three by simply giving them a lower maximum score of 2 versus a 3. You’ll also notice no column for ‘Flavor’. It’s too hard for me to score based on flavor as that is pretty mood-dependent, and hopefully that information is covered by the other columns anyways.

Results
Note: Lower score is better.

6 – Crispix
7 – Honey Bunches of Oats
8 – Cinnamon Toast Crunch
8 – Frosted Flakes
8 – Life / Cinnamon Life
9 – Captain Crunch
9 – Froot Loops
9 – Fruity/Cocoa Pebbles
9 – Lucky Charms
9 – Trix
9 – Rice/Cocoa Krispies
9 – Cheerios (all types)
10 – Cocoa Puffs
10 – Oatmeal (non-instant)
10 – Cream of Rice
10 – Cream of Wheat
10 – Raisin Bran
10 – Special K
11 – Apple Jacks
11 – Corn Pops
11 – Golden Grahams
11 – Kix / Berry Berry Kix
11 – Cookie Crisp
11 – Honeycomb
11 – Frosted Mini-Wheats
11 – Wheaties

Full Data

Discussion

The results are interesting, but still expected. You’ll notice that the fun and texture of the fruity cereals clusters them in the middle, dragged down by their lack of healthiness. Only a few cereals really get to the top of the list, and I’m delighted to see Crispix and Honey Bunches of Oats up there (and next to Cinnamon Toast Crunch which is probably the best flavor). With some cut banana and/or berries, those first two are the most satisfying cereals, down to drinking the last drop of milk. Finally, we see the hot cereals in the middle of the pack as well, high on health but low on fun and texture.

I acknowledge that this list is not comprehensive. For example, it has been pointed out to me that I am missing Raisin Bran Crunch which is a pretty popular cereal of choice these days. I also forgot Clusters / Honey Nut Clusters which I was huge on for a while as a kid. Whoops!

I also acknowledge there is some bias built into this scoring, as what I believe is “fun” or “good texture” is different from what you will think is “fun” or “good texture”. However, it’s a quick algorithm that you could apply to anything to help understand not only the elements being measured but also about the person doing the measuring.

Oh, and if you were wondering, I bought Honey Bunches of Oats.

dynamically-weighted surveying

There are plenty of websites that try to characterize you based off a set of responses. Some surveys come via email and ask you to tally up your own score and see how you compare to the rest of the world. Some just try and answer a simple question such as what personality type or how happy or how outdoorsy you are. They’ll give 10 questions and based off how many you answer correctly, you fall into some category. Some more sophisticated applications may weight questions by importance and mathematically calculate a percentage that represents your characterization. For simplicity sake, I guess they do the job.

But here’s another idea…
One more method of weighting questions in a survey might be based off global survey or consensus results. For example, if I was to compute a score that asked, “How much of a Yankees fan are you?” two questions might be:

1) Do you hate the Red Sox?
2) Have you been to a game this year?

If a large survey was given, possible/expected results for these questions might be:
1) 99% Yes, 1% No
2) 20% Yes, 80% No

Based off these responses for a relatively large population, we can weight how much each question should factor in to the final result. For our example, since practically everyone hates the Red Sox, responding Yes should not play a majority factor in calculation of the final characterization. But since going to a game this year is a bit more of a rarity, perhaps it should contribute a higher amount to your final score. The trick is that for binary responses, you must denote which response increases the score and which decreases (it would be smart to gear the questions so that the affirmative case is always the increaser).

Taking this a step further, a lot of times the consensus of a larger group may not be known. In that case, your answers should become dynamic inputs to the weighting algorithm. They start at 50/50 and dynamically shift based on each new, incoming response. In a sense, the sensitivities are set by each new instance of that survey. Additionally, for non-binary / categorical / multiple choice responses, it would just require a bit more careful examination of weighting constituents.
Ill hopefully have an example of this weighted implementation in a near-future post.

update: this year in baseball

On February 22, 2009, I posted my baseball predictions for this year. Today I went back to see how those predictions were turning out and was pleasantly surprised. Here’s how I stand:
Predicted Final AL East Standings (February 22, 2009)
Yankees 101-61 (62.35%)
Red Sox 95-67 (58.64%)
Rays 84-78 (51.85%)
Blue Jays 80-82 (49.38%)
Orioles 72-90 (44.44%)
Current AL East Standings (July 24, 2009)
Yankees 58-37 (61.05%) –> 99-63
Red Sox 55-39 (58.51%) –> 95-67
Rays 52-44 (54.17%) –> 88-74
Blue Jays 47-49 (48.96%) –> 79-83
Orioles 41-53 (43.62%) –> 71-91
The order is correct and collectively the winning percentages are off by an average of 1.00%. If calculating a final win count off current winning percentages, Yanks are off by 2 wins, Red Sox are exactly right, Rays are off by 4 wins, Blue Jays are off by 1 win, and Orioles are off by 1 win. Not too bad I must say… but reveal my methods? Hah!
The other prediction of Cubs playing the Yanks in the World Series may be a bit of a stretch, but they are only 3 games back in the NL Wild Card and are 5-2 out of the All-Star break. Still a possibility.
Finally, I hope I don’t jinx myself here but I’ll pass along a post of why the Bronx Bombers will be winning the AL Pennant. I agree with the power, health, and depth, but it’s too soon to make predictions off current streaks coming out of the all-star break.
“A humble man of grace and dignity. A captain who led by example. Proud of the pinstripes tradition and dedicated to the pursuit of excellence. A Yankee forever.” – Don Mattingly’s plaque in Monument Park

early childhood math education

“Evidence shows that early success in math is linked to later success in both math and reading. Given the increasing importance of science and technology in everyday life and for gaining entry into many careers, it’s crucial that we give all children a strong foundation in math and that we start many years before they enter formal schooling.”

With the recent publication by the National Research Council on early childhood mathematics, I thought I’d post a little summary with some thoughts of my own. I have always had interest in education policy, curriculum development, and ways to close the educational gap in the United States and around the world.
I believe even the smallest steps can lead to vast improvements, and the general idea is awareness then action, fueled by collaboration. Make the problems fully known and understandable, and then provide mechanisms through which those problems can be addressed at the individual, family, community, local/town, state, regional, national, and international levels.

I have particular interest in mathematics, science, and technology education and hope to stay involved in this realm for my entire life. Since it is quite high on today’s national policy agenda, hopefully action will be expedited to show progress domestically. Then in fixing our national education system, we can serve as a good example to developing nations in how to structure early education and community programs to maximize intellectual growth.

Click here for a Science Daily article about the report.

Here’s an excerpt from the report description:

“Early childhood mathematics is vitally important for young children’s present and future educational success. Research has demonstrated that virtually all young children have the capability to learn and become competent in mathematics. Furthermore, young children enjoy their early informal experiences with mathematics. Unfortunately, many children’s potential in mathematics is not fully realized, especially those children who are economically disadvantaged. This is due, in part, to a lack of opportunities to learn mathematics in early childhood settings or through everyday experiences in the home and in their communities. Improvements in early childhood mathematics education can provide young children with the foundation for school success.”

Some more highlights:

  • Math education must start at the earliest possible age. A coordinated national early childhood mathematics initiative should be put in place to improve mathematics teaching and learning, particularly for ages 3 to 6.
  • We must engrain mathematics and statistics as an environment and a behavioral necessity at an early age. Analytical processing, spatial thinking, and problem solving skills should become part of every day life at a very young age. The report says mathematics experiences in early childhood settings should concentrate on: A) numbers (whole numbers, operations, relations), and B) geometry, spatial relations and measurement. “How should I cut the cake so that everyone gets a piece?”
  • Mathematical process goals should be integrated in other content areas. Math should not be a stand-alone subject but should be a part of the curriculum for history, english, art, music, and other subjects/classes.
  • We must improve the technical and scientific literacy of the general public. This should be done by promoting “number comfort” from early education through adolescence and making math and science education a family, real life, and every day thing.
  • There need to be revised professional development initiatives for educators reflecting science/technical/mathematical curriculum needs.
  • Early childhood education partnerships should be formed between family and community programs to work together in promoting children’s mathematics.
These highlights offer just a glimpse of what is in the comprehensive report, which includes full-scale curriculum, professional development, and implementation recommendations.

In my own point of view, I think there needs to be some sort of accreditation program for mathematics and statistics education, covering preschool, elementary school, middle school, and high school (truly, high school is a different story, but certainly some aspects by which the Pre-8 schools might be evaluated are applicable to grades 9-12 as well). A stepwise and gradated approach to evaluation of statistical/mathematical initiatives should help schools work from their current status to a desired and achievable one.

I am aware of accreditation programs that do currently exist at the state and regional levels (although it seems as though most are for a school as a whole and not individual subject areas). On the contrary, I am unaware of the steps these types of evaluation programs take to ensure that systematic inequalities don’t impact evaluation results. Subject-level evaluation programs should not reward schools but rather provide valuable feedback and awareness for all types of early education programs. It should provide a framework for schools to understand their relative status, in conjunction with possible areas for improvement, on a local, national and international level.
I believe evaluation of mathematical/statistical initiatives should take place at these core levels:
  • Administration/Management – Quantitative methods should be made operational in the management and evaluation of educators within the school system. It not only promotes understanding of such methods, but is also an engine for measurable results, positive reinforcement, professional development, and recognition. In some sense, schools are run like a business that should employ quantitative methods to ensure profitable return, an optimized allocation of resources, and quality control. Employ the DIS cycle and school administration will certainly find it easier to know what works, and what does not.
  • Culture/Community – As stated in the NRC report, partnerships must be formed between the student, school, family, and local community. Evaluation should occur on how well a school takes steps to forge and maintain these relationships. How much do children hear about math in school as opposed to out of school?
  • Curriculum – The most obvious one involves evaluation of the process by which a school teaches math and statistics. Does the school sustain its process equally over time? Do educators use a wide array of techniques to teach mathematical concepts?
In the end, something needs to be done and the NRC report is the right first step towards awareness. With the use of some simple quantitative methods and collective brainpower, we can take action to decrease inefficiencies and close the national and international education gaps in mathematics and science, and in turn, many other subjects… Use data to evaluate, support, and improve!