bogeys and birdies

Sports are great because they are all so unique. The rules, methods, people, challenges, results, rewards, feelings, and takeaways are all different depending on what you’re playing, who you’re playing with, and the level at which you are playing it.

Although I don’t play it nearly as much as I wish I could, I find golf to be one of the most intriguing and rewarding experiences. Here’s why:

The Pace – Slow and relaxing, there’s plenty of time to think about each shot and take in the surroundings.
The Science – Angles, calculations, rolls, spins, trajectories, and slopes all make it a mind game as much as it is a physical one.

The Atmosphere – With the aura around the clubhouse, concentration on each individual shot, and the interaction with nature, it’s always refreshing and relaxing.
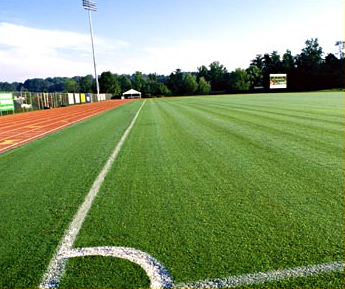
The Landscape – The surroundings are always different with so many possibilities with weather, time, and season. Even on some cheaper public courses, the hills, trees, and sand always make an invigorating, lively piece of art and nature.
The Anticipation – Every shot might be the best shot. I sometimes freeze myself up before hitting a 8 or 9 iron because I begin to think I’m lined up so perfectly that I’m going to sink it. Then I’m already thinking about my reaction if I sink it. Then I can’t shoot at all and need to re-think my shot all over again. It’s a fun cycle of anticipation and anxiety.
The Goosebumps – Phil jumping after sinking his putt on 18 at the 2004 Masters. Tiger’s chip-in on 16 at the 2005 Masters. Goosebumps every time.

The Party – You can’t beat golfing with good friends… having good conversation, a good opportunity to meet new people, a good opportunity to build relationships, and a good opportunity to enjoy some beers, dogs, seeds, and cigars.
The Luck – I’m convinced that it’s not a purely mechanical game. There are some things you cannot calculate, such as the wind 75 yards away and 100 feet up or the surface moisture or dead spot 10 yards from the green. Therefore the rest of the game is filled in by luck – good bounces, rolls, gusts, and magical forces.
The Rules – It’s a game of honor, patience, and etiquette, and therefore helps guide life lessons. Noonan

The Unattainable – One always can improve. There is always more to learn, and every game is different. It never gets old and tomorrow is a new day. No one has ever hit an ace or eagle on every hole and that should make you strive to keep playing and improving. Most people have never hit an ace, and that alone gets me out there with excitement each time.

I’ll end with the best advice on golf I’ve received, from my cousin Kenny… Go through the same routine before and during every shot. Same steps, thoughts, swings, pauses, breaths, and time. With consistency comes improvement (and more manageable mistakes).
The Zen philosopher Basho once wrote, “A flute with no holes is not a flute. A donut with no hole is a danish.”
Photo 1: My whacked out swing at Rock Creek Golf Course, great photography from Benny T.
Photo 2: East Potomac (Blue) Golf Course on 5/30/2009, with my favorite tree in the world in world in front (Japanese Red Maple) and a nice Weeping Willow in the back left.

data visualization

The visualization of data exists at the intersection of art, science, and technology. The absence of one of these inputs leaves the viewer unsatisfied in terms of both comprehension and stimulation.

It takes both hemispheres of the brain to produce a truly outstanding graphic – a mesh of logical and analytical components with intuition and creativity. Creators must know the basics of audience, tone, color, consistency, and purpose while understanding technical and scientific limitations of particular data analyses and visualization methods/tools. Creators must also be their own best critic, and be able to ask the right questions at the right time. When done correctly, a final result should bring engaged thinking and meaning to a viewer, no matter how simple the underlying objective.

That being said, I wanted to post some interesting data viz resources to hopefully inspire new creativity and awareness around data visualization. Those are listed below. As a note, some were listed in the latest issue of AmstatNews (monthly publication for the American Statistical Association). All descriptions are from the respective websites and/or other related web resources.

Websites
Flowing Data – FlowingData explores how designers, statisticians, and computer scientists are using data to understand ourselves better – mainly through data visualization. Money spent, reps at the gym, time you waste, and personal information you enter online are all forms of data. How can we understand these data flows? Data visualization lets non-experts make sense of it all.
Gallery of Data Visualization – This Gallery of Data Visualization displays some examples of the best and worst of statistical graphics, with the view that the contrast may be useful, inform current practice, and provide some pointers to both historical and current work.
Gapminder – Gapminder is a non-profit venture promoting sustainable global development and achievement of the United Nations Millennium Development Goals by increased use and understanding of statistics and other information about social, economic and environmental development at local, national and global levels.
Graph Jam – Music & culture for people who love charts. Some recent posts include “Ways I spent my time while playing Oregon Trail in elementary school” and “Things that the Pinball Wizard does”.
IBM Many Eyes – As part of IBM’s Collaborative User Experience research group, the Many Eyes lab explores information visualizations that help people collectively make sense of data.
Information Aesthetics – Inspired by Lev Manovich’s definition of “information aesthetics”, this weblog explores the symbiotic relationship between creative design and the field of information visualization. More specifically, it collects projects that represent data or information in original or intriguing ways.
Junk Charts – Recycling chartjunk as junk art.
Marumushi Newsmap – Newsmap is an application that visually reflects the constantly changing landscape of the Google News news aggregator. A treemap visualization algorithm helps display the enormous amount of information gathered by the aggregator. Treemaps are traditionally space-constrained visualizations of information. Newsmap’s objective takes that goal a step further and provides a tool to divide information into quickly recognizable bands which, when presented together, reveal underlying patterns in news reporting across cultures and within news segments in constant change around the globe.
NameVoyager/NameMapper – This is the online home of Laura Wattenberg, author of the bestselling book The Baby Name Wizard and creator of award-winning tools that have helped the world look at baby names in a whole new way. Check NameVoyager and NameMapper which show temporal and geographic representations of any name in a simple, intuitive interface.
Optical Illusions and Visual Phenomena – Easy to spend lots of time here. These pages demonstrate visual phenomena, and ‘optical’ or ‘visual’ illusions. The latter is more appropriate, because most effects have their basis in the visual pathway, not in the optics of the eye.
Prefuse – Prefuse is an extensible software framework for helping software developers create interactive information visualization applications using the Java programming language. It can be used to build standalone applications, visual components embedded in larger applications, and web applets. Prefuse intends to greatly simplify the processes of representing and efficiently handing data, mapping data to visual representations (e.g., through spatial position, size, shape, color, etc), and interacting with the data. Flare is particularly cool.
Tableau Software Blog – Official blog for Tableau Software, a data visualization software company headquartered in Seattle. I’ve used Tableau Desktop for a few years now and can’t live without it now.
The Work of Edward Tufte and Graphics Press – Official Edward Tufte site. He is an American statistician and Professor Emeritus of statistics, information design, interface design, and political economy at Yale University. He has been described by some as “the da Vinci of Data”.
UC Berkeley Visualization Papers – A listing of papers from the visualization lab at UC Berkeley, from today back to 1995.
Visualization of Complex Networks – This site intends to be a unified resource space for anyone interested in the visualization of complex networks. The project’s main goal is to leverage a critical understanding of different visualization methods, across a series of disciplines, as diverse as Biology, Social Networks or the World Wide Web.

Well-Formed Data, Elastic Lists Demo – This is a demonstration of the “elastic list” principle for browsing multi-faceted data structures. There are additional options to create sparkline charts to show the temporal aspects of the data.
Papers / Presentations
7 Things You Should Know About Data Visualization – EduCause Learning Initiative
Artistic Data Visualization: Beyond Visual Analytics – Viégas & Wattenberg, IBM Research
Designing Great Visualizations – Jock Mackinlay, Tableau Software
Milestones in the History of Data Visualization – Friendly & Denis, York University

adsideology 2 and the one brain

At the intersection of science, religion, politics, and philosophy you’ll find some quality, creative thought. I find it interesting that there exist discrete boundaries between these subjects, although these boundaries have traditionally existed between all subjects. That being said, over the past several years it’s clear that many major universities are fuzzifying these boundaries through interdisciplinary departments, research positions, and classes. This is necessary to weld together the right brains of new experts and forward thinkers around the world (with, of course, the logistical, process-oriented, left-directed thinkers that still power much of our world). Let’s call it the One Brain concept – similar to the One Medicine, One World, One Nation, and other Onenessisms developed in recent times.

Adsideology is very much a One Brain idea. It’s not a religion, it’s not a science, it’s not a political belief, and it’s not a personal stance. It’s just a concept that brings together a lot of thoughts and ideas that make me happy and healthy as a human being. With that in mind, I hope to share my thoughts in an effort to drive positive, creative thought in you, hopefully resulting in the same happiness and health that I see in my life.

Back to the fuzzification of subject boundaries, there does need to be more of an effort to drive interdisciplinary thought at a younger age. College classes in “Physics and Philosophy” are certainly good, but those types of thought mixtures need to occur at an earlier age. As the right-brain world emerges as the driver of disruptive technologies, innovative thinking, and new creative logic, this direction should be fostered in early developmental stages of life – in school, at home, at church, on tv, in music, through art, at dinner, and everywhere your one big brain may venture.

I’ll leave you with a poem written by Piet Hein who was a Danish mathematician, physicist, philosopher, writer and creator of puzzles and games:

The Paradox of Life:

A bit beyond perception’s reach
I sometimes believe I see
that Life is two locked boxes, each
containing the other’s key.

happy pi day!!!

Shapes. Spirals. Belief. Skepticism. Hunger. Conflict. Love. Anger. Space. Time.

All are forever and irrational – think about it. It’s exemplary of why pi is so unique. Irrationality is a concept applicable to many aspects of life, and to mentally grasp what it means to be irrational is an exercise in itself. In a numerical sense, pi is the ratio of a circle’s circumference to its diameter. Simple, right? But a circle, so perfect, is no ordinary thing.

Today is Pi Day, March 14th (3/14). Take a minute or two and do a web search for “pi”. Read the wikipedia article. You’ll see it’s not just a number but a reflection of many aspects of life.

Don’t you notice why so many desserts are round? That’s what everyone enjoys about them; you can have your pi and eat it too.

geometry in soccer

Soccer is a beautiful game of people and sciences: psychology (see post: mind-bend it like beckham), biology, and among others, mathematics. In particular, geometry can be found in almost all aspects of the game. To the standard viewer, these applications may not seem obvious. It probably looks like a bunch of people kicking a ball towards a common goal trying to keep another team from scoring on their own. That’s true, but it’s the science and language of movements that make one team beat another.

First, the simple applications of geometry and topology in soccer. The field is rectangular in shape with other shapes creating boundaries, halves, penalty boxes, corners, and goals. The field is geometrically symmetrical. The ball is semi-spherical adding it’s own element in shot curvature, reflections, etc. The shot itself must take on a very calculated velocity (angle + speed). Passing with a give-and-go, long ball, or off the wall indoors are all derivatives of geometric shapes. Using a wide-angled pass is less probable to be intercepted than a “square” pass. The wall aims to accomplish much of what a goalie does against a breakaway: take away the angle. Setting up a wall at 1o yrds or a goalie coming off a line reduce the target for a shooter. The cross must be a calculated trajectory, usually bending in or out to give more advantage to the goal-scoring team. Bending out allows for a more forward angle versus a completely perpendicular cross which is much tougher to head towards a desired target. These are some simple components of soccer in which geometry “takes shape”.

Let’s also think about team formation and spatial distribution around the field. Formation is not random, and it’s known that having the optimal formation at any one time greatly increases the chance of achieving an objective, whether that’s scoring a goal, playing stiff defense, maintaining possession, or slowing the game pace.

Connectedness: How many neighbor nodes does the person with the ball have? How passing options are there currently? The more interconnected the 11 nodes might be, the more optimized the network.

Compactness: The team should be like an accordion that can open and close, adapt and react, become dense and spread out. Localized compactness assists in defense, spreading out opens up for offense.

In passing, triangular formation creates multiple opportunities to give-and-go. Moving without the ball to create shapes builds the passing support network that creates scoring chances. Thinking ahead of reflected or return passes based on complementary angles off your teammate will get you the ball back in stride. Combine this geometric intuition with a good mental game is key.

In all, having a locally-connected space and visualizing complementary angles is advantageous for any team. The name of the game is adaptation and proaction. Thinking 3 passes ahead, using all sciences in your toolbox both mentally and physically, and anticipating the faults of your opponent will surely increase the probability of a win. Having a kick ass shot doesn’t hurt either.

mind-bend it like beckham

I’ve played soccer for pretty much my entire life. According to some quick calculations, I’ve probably spent almost 10,000 hours around soccer (practices, camps, indoors, outdoors, games, high school, middle school, intramurals, adult leagues, premier teams, district teams, travel teams, tournaments, refereeing, etc.). That’s equivalent to over 400 full days – over a year if I played all day/night (which sometimes I think I did).

Now considering I’m 24, that means about 1/24th of my life has been on the soccer field. To put that in perspective, I probably eat for 1.5 hours a day which would be 1/16th of my day. Therefore, eating and soccer combined have taken more than 1/10th of my life. Subtract sleeping, school, and work, and how much free time did I really have for a bat and turkey catching club (P.A.B.A.T.)?

The point is that I love the game. One must be physical but sensitive, dynamic yet passive, and logical yet imaginative in order to be a complete player. This balance of attributes while being prepared mentally will always make someone an asset to their team.

I think most of all it’s the pre-game mental preparation and in-game mind-reading that make it so much fun (and I’m talking not just of your opponents, but of your own players too). Studying the other team means identifying stand-out players or leaders and recognizing weaknesses in formation. Studying your team means knowing players’ strengths, weaknesses, and most of all, tendencies. You should be able to move as a cohesive unit and almost play blindly – the best teams I’ve been on have been where I can pass the ball without looking, knowing someone will be there who will know what I am expecting them to do with it.

While in the game, it’s about reading minds of players. Anticipation and probabilistic expectation play huge roles in gaining an advantage on the other team. A quick analysis of 2 connected passes should lead you to forecast subsequent moves based on the prior movements of nearby players.

It’s true, soccer is math, and really I mean it. Optimize your position and forecast movements based on prior states – all from looking at someone else’s eyes, hearing their communication, and most of all, intuition based on thousands of hours of experience. It’s pretty simple.

“The scoreboard never lies but it rarely tells the whole truth.”