data visualization

The visualization of data exists at the intersection of art, science, and technology. The absence of one of these inputs leaves the viewer unsatisfied in terms of both comprehension and stimulation.

It takes both hemispheres of the brain to produce a truly outstanding graphic – a mesh of logical and analytical components with intuition and creativity. Creators must know the basics of audience, tone, color, consistency, and purpose while understanding technical and scientific limitations of particular data analyses and visualization methods/tools. Creators must also be their own best critic, and be able to ask the right questions at the right time. When done correctly, a final result should bring engaged thinking and meaning to a viewer, no matter how simple the underlying objective.

That being said, I wanted to post some interesting data viz resources to hopefully inspire new creativity and awareness around data visualization. Those are listed below. As a note, some were listed in the latest issue of AmstatNews (monthly publication for the American Statistical Association). All descriptions are from the respective websites and/or other related web resources.

Websites
Flowing Data – FlowingData explores how designers, statisticians, and computer scientists are using data to understand ourselves better – mainly through data visualization. Money spent, reps at the gym, time you waste, and personal information you enter online are all forms of data. How can we understand these data flows? Data visualization lets non-experts make sense of it all.
Gallery of Data Visualization – This Gallery of Data Visualization displays some examples of the best and worst of statistical graphics, with the view that the contrast may be useful, inform current practice, and provide some pointers to both historical and current work.
Gapminder – Gapminder is a non-profit venture promoting sustainable global development and achievement of the United Nations Millennium Development Goals by increased use and understanding of statistics and other information about social, economic and environmental development at local, national and global levels.
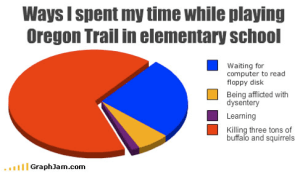
Graph Jam – Music & culture for people who love charts. Some recent posts include “Ways I spent my time while playing Oregon Trail in elementary school” and “Things that the Pinball Wizard does”.
IBM Many Eyes – As part of IBM’s Collaborative User Experience research group, the Many Eyes lab explores information visualizations that help people collectively make sense of data.
Information Aesthetics – Inspired by Lev Manovich’s definition of “information aesthetics”, this weblog explores the symbiotic relationship between creative design and the field of information visualization. More specifically, it collects projects that represent data or information in original or intriguing ways.
Junk Charts – Recycling chartjunk as junk art.
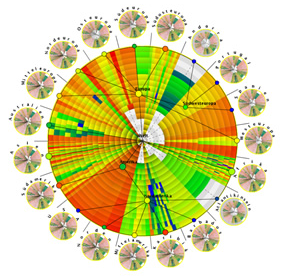
Marumushi Newsmap – Newsmap is an application that visually reflects the constantly changing landscape of the Google News news aggregator. A treemap visualization algorithm helps display the enormous amount of information gathered by the aggregator. Treemaps are traditionally space-constrained visualizations of information. Newsmap’s objective takes that goal a step further and provides a tool to divide information into quickly recognizable bands which, when presented together, reveal underlying patterns in news reporting across cultures and within news segments in constant change around the globe.
NameVoyager/NameMapper – This is the online home of Laura Wattenberg, author of the bestselling book The Baby Name Wizard and creator of award-winning tools that have helped the world look at baby names in a whole new way. Check NameVoyager and NameMapper which show temporal and geographic representations of any name in a simple, intuitive interface.
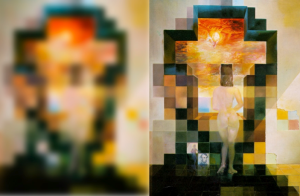
Optical Illusions and Visual Phenomena – Easy to spend lots of time here. These pages demonstrate visual phenomena, and ‘optical’ or ‘visual’ illusions. The latter is more appropriate, because most effects have their basis in the visual pathway, not in the optics of the eye.
Prefuse – Prefuse is an extensible software framework for helping software developers create interactive information visualization applications using the Java programming language. It can be used to build standalone applications, visual components embedded in larger applications, and web applets. Prefuse intends to greatly simplify the processes of representing and efficiently handing data, mapping data to visual representations (e.g., through spatial position, size, shape, color, etc), and interacting with the data. Flare is particularly cool.
Tableau Software Blog – Official blog for Tableau Software, a data visualization software company headquartered in Seattle. I’ve used Tableau Desktop for a few years now and can’t live without it now.
The Work of Edward Tufte and Graphics Press – Official Edward Tufte site. He is an American statistician and Professor Emeritus of statistics, information design, interface design, and political economy at Yale University. He has been described by some as “the da Vinci of Data”.
UC Berkeley Visualization Papers – A listing of papers from the visualization lab at UC Berkeley, from today back to 1995.
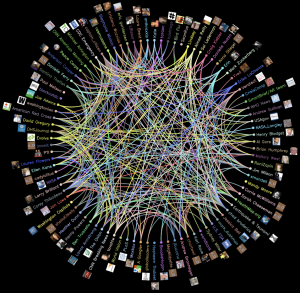
Visualization of Complex Networks – This site intends to be a unified resource space for anyone interested in the visualization of complex networks. The project’s main goal is to leverage a critical understanding of different visualization methods, across a series of disciplines, as diverse as Biology, Social Networks or the World Wide Web.

Well-Formed Data, Elastic Lists Demo – This is a demonstration of the “elastic list” principle for browsing multi-faceted data structures. There are additional options to create sparkline charts to show the temporal aspects of the data.
Papers / Presentations
7 Things You Should Know About Data Visualization – EduCause Learning Initiative
Artistic Data Visualization: Beyond Visual Analytics – Viégas & Wattenberg, IBM Research
Designing Great Visualizations – Jock Mackinlay, Tableau Software
Milestones in the History of Data Visualization – Friendly & Denis, York University

start using twitter

Overview What is it?
It’s an easy-to-use application that provides a unique method of networking, news gathering, and friend updates – all in an environment void of censorship or maybe professional restrictions (although there are some general guidelines to follow). Start by setting up your free account, editing settings, personalizing your page, and then researching the use a bit. TubbyBundle has a blog post that is a good resource for beginners, and hopefully the below info can help as well. As of the end of March 2009 there were over 9 million site visitors, a number more than twice that of Feb 09. It will grow more as an acquisition is close to integrating it with everyday Google products…

Definitions & Meanings What do I need to know?

Tweet – A single post of 140 characters or less using Twitter
Followers – People who follow your updates (depending on your settings, you can be open to the public, or require approval before someone becomes a follower)
Following – People whose updates you follow (depending on their setting, you may need to be approved before you can follow)

Mentions – Formerly known as “@Replies”, you can use the “@” symbol before a username to mention another twitter user in your tweet. Instead of mentioning that person by name, mention them by username using the “@” symbol before their username.
Re-Tweets – You can re-tweet something someone else posted. This is useful to spread a post to your network in cases where it may bring good value (and it properly cites the original user who posted it)
Direct Messages – You can write directly to another user that you follow (so nobody else can see that tweet but that user).
Hashtags – Unique way to follow certain topics. Follow the user “hashtags” and they will immediately request to follow you. Then the system can automatically index tags you apply to your tweets and you can follow other topics of your choosing. 
StrategyWhy am I using it and how will I use it?
Is this for business use or for personal use? Will I post news articles I find interesting? What topics would I consider interesting? Is there a niche to fill in my area of interest? Who do I want to be my audience i.e. who will I seek to follow? (news, NGOs, celebs, friends, strangers, experts, academics, etc). Consistencies are nice, but not absolutely necessary (punctuation, humor, cursing, tone, frequency, etc). In my opinion, the best strategy involves being multi-dimensional with some structure to your posts. Maintaining some level of frequency is important while using similar language/structure also helps portray your personality through each tweet, which is important to your followers. I like to post on math, science, me, hot topics, numbers, technology, blog posts, humor, sports, food, education, history. Wide range of stuff, but all within the realm of who I am. I like to post a few in the morning, few in the afternoon, and maybe in the evening on some sports or food or something of that sorts to bring the day to a close – an interesting way to decompress the day is to summarize in 140 characters – weird, right?
Additionally, link your Twitter account up with other social networking or personal applications such as Facebook, LinkedIn, personal blog, etc. Keep in mind the different audiences and who may have access to what you’re posting. If you’re Tommy Lee on Facebook but Martha Stewart on Twitter, either don’t link them or go see a psychiatrist.

Applications – What’s out there for me to use?
There are plenty of web applications, desktop applications, and phone applications to choose from. Check out the Twitter PBwiki page for a comprehensive listing. Some I’d recommend:

  • Web – Use the Twitter homepage or use Twitpic to post images.
  • Desktop – Spaz is a simple app to start if you don’t follow many people. TweetDeck is nice because you can categorize who you follow. I’d go with TweetDeck.
  • Phone – I use Twitterific on the iPhone. I’d change a lot of things on it but it works for now.


Other Resources

Spend some time on the Twitter PBwiki page listing additional resources. Click around on some as they are quite fun. Some good ways to find similar users in your location, follow topic trends, and find out how valuable your page really is. I won’t go through them all but I’ll list a few:
  • TweetValue – get a monetary value of your twitter page
  • Twitterank – see how your user rank gets better over time
  • TinyURL – shorten URLs to put in your tweets
  • Twitter Search – search the public timeline of tweets
  • TweetWheel – see connections b/n you and your friends
  • Twitter-Stats – see stats about you with a visual or two
  • WeFollow – user-generated Twitter directory
Visualization of those I follow and our shared connectivity (from TweetWheel)…
Lastly, have some fun finding value in Twitter. Go to the pages of your close friends and see who they follow, and follow them. Search on some topics and find people who post regularly on topics of interest. Find the news organizations you watch on TV. Find similar users in your area. Don’t follow everyone, but you’ll have the ability to build a network of direct contacts and a feed of real-time info that should be engaging and interesting to you as a daily web user.

a view from above

How can you not love the sky? I just took this picture from seat 15F on my flight to Chicago O’Hare. I always get a window seat when I fly because I need to see what’s out there below me and above us. This one shows some good cumulus puffs with the most awesome contrast of the clear blue sky. For loving science, and despite having multiple science classes devoted to clouds, weather, the atmosphere, and meteorology, clouds will always amaze me beyond the grasps of physical properties for some reason.

Some people are afraid of flying. I can understand why, as turbulence still makes me jittery and the ear-popping is less than comfortable. However, I can’t forgive others for not finding inspiration in flying 30,000 feet up in the air. It’s a world for imagination and reflection, not to mention a natural artistic wonder unique only to that altitude.

Perhaps the most fun parts of flying are the takeoff and approach, or in other words, zoom out and zoom in. It’s neat to see the houses get smaller and smaller as you zoom out. It’s fun to begin to recognize specific neighborhoods, buildings, or characteristics of the land as you zoom in. Swimming pools become stand outs in the summer. Snow truly looks like a blanket in the winter.

I like to think about history when I’m up in the sky. Scientists, astronomers, philosophers, and the rest of the general population never had the luxury to see above the clouds like I can. I wonder if science and discovery would have taken place differently had the Greeks been able to see down on the earth and up into the sky from 30,000 ft up in the air. I wonder if they’d serve grape leaves on their flights?

Either way, that was a good nap. Time to zoom in now.

“Above the cloud with its shadow is the star with its light. Above all things reverence thyself.”
–  Pythagoras

knowledge management and organizational learning

Organizations are built and sustained by the collective brain power of its members. But that collective brain power is only as good as the memory that serves it up. And so was defined knowledge management.

Fundamentally, knowledge management (KM) is the effective administration of people, processes, technology, and information.* In encapsulates the concept of organizational knowledge/learning, which is the collection of facts, methods, and expertise by a group of people for dissemination and use. These days, the wide scope of new organizational knowledge coupled with the speed at which it gets developed leads to a distinct requirement to capture and centralize the knowledge. As a result, innovators and thinkers will be enabled to collectively work toward building new products and technologies while feeding back into the cycle of strategic thought.

Knowledge is king. Storing, sharing, and learning from it is royalty. This realization has progressed over the past decade or so into a “google”plex dollar business (“googolplex” is my favorite number – i’ll post on it at some point). But why are some organizations and some people so resistant to implementing proper KM practices?
Knowledge management needs to be part of every company strategy and needs to be ingrained in each of its four main components: people, processes, technology, and information. It should branch into all departments – and for each become the engine of collaboration and the backbone of innovative thought. Whatever technology is implemented to enable effective knowledge management, it should have dedicated support, alignment with existing security protocols, and proper branding and marketability as an engaging tool to use.

The benefits must also be made visible. Incentivize users to contribute knowledge in a semi-structured form. Make it something that is talked about in meetings, used in positive performance evaluations, built into non-work related worlds (as a place to “escape”), and an activity that is comforting and welcome amongst all levels of employees.

Within specific job functions, it’ll open up opportunities for valuable feedback. Jeff Lash, from his “How To Be A Good Product Manager” blog, has a good post on knowledge sharing and its benefits within Product Management. Everyone has “lessons to share, but even more to learn” he says. This philosophy is applicable to everyone and every job function – technical development, analysis, sales, marketing, management, etc. That’s why KM is necessary for innovation and success and as part of an over-arching business strategy. The improvement of learning across the organization will be measurable in every day communication, work efficiency, and eventually, revenues. 

Lastly, it’s worth noting that with KM, the design and implementation effort is a topic of its own (of which I’m quite fond). But hey, strategize first.

*Other definitions can be found on the KM Forum.

wearing other people’s shoes

It’s just as easy to get tunnel vision as it is to be blinded by the light. And most of the time, these metaphors hit us hand-in-hand. That’s why it’s imperative that we find a way to step back from the lives we live and experience the minds and lives of others. We all need to live in perspective of neighbors, a community, a country, a world, a universe, and beyond – the positive impact on health, compassion, and a greater good are infinitely realizable.

I find myself stuck in my own head quite often. Not that my cognition has devilish control over my body and soul, but I frequently think about my life, my goals, my history, my future, my lunch, my finances, my vision, my health, my hobbies,… well, you get the point. That tunnel vision not only limits my knowledge of and interaction with the outside world, but also puts me in a dangerous position to hit a one-way mental road block. I can only find opportunity to avoid that road block if I create the highways, byways, and multi-directional pathways through which I can creatively navigate.

Adsideology encapsulates that notion of universalism – that most concepts are applicable to all people. This isn’t an all-encompassing theory by any means, but rather a concept of wearing other people’s shoes. I exist as does the person next to me, and I make decisions as does the person next to him or her. My life exists not in a vacuum, but in alignment with the lives of billions of others. We all have obstacles and achievements, goals and passions, ups and downs. The realization of all those other feelings helps contextualize the life I live and it’s not until I am standing in someone else’s shoes that I can more clearly see the footprints that I am making. Lose the tunnel vision, blind yourself with compassion, and jump in someone else’s shoes – you’ll be a better person for doing so.

tower of power

You can’t beat Tower Of Power. Last night at the State Theatre in Falls Church, VA was an absolute groovefest. I can’t even move right now my legs are exhausted from two steppin’ it all night. With hits like “Soul With a Capital ‘S'”, “I’ve Got To Groove”, “You’re Still a Young Man”, and “Diggin On James Brown”, the theatre was in bump city with vivacious vocals, bellowing bass, and hip-swingin’ horns.

The half-seated / half-standing venue was packed with mid-sixties, mid-forties, and two mid-twenties bouncin’ to the brim as every seat in the house was within arms’ reach of the trumpet line. As a side treat, the audience included two other legends, one from the Temptations and one from James Brown’s band, both grabbing the mic for a line or two as they stood front row. Good music certainly has no age limit and some current young guns could learn a thing or two from these hipsters of hop. I’m quite glad my mom (who is a two steppin’ legend) introduced me to T.O.P. and it ranks up pretty close to the TOP on my list of greatest performances seen live.

If you want to check out Tower Of Power, click here for a list of their upcoming tour dates. If you don’t want to check them out, then you got to FUNKIFIZE!